Insight
From Depth Camera to 3D Insights
Published on January 01, 2026
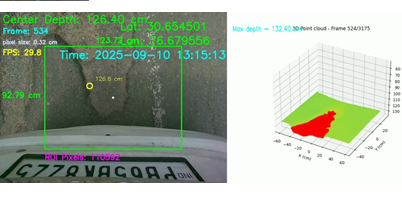
In modern computer vision and autonomous systems, depth sensing plays a crucial role in understanding the 3D structure of the environment. This blog showcases how real-world depth data is captured and visualized using a depth camera, combining live video frames with 3D point cloud mapping for accurate distance and surface perception. The visuals below represent one captured frame and its corresponding 3D visualization — the left side shows the live camera view with depth overlays, while the right side illustrates the same scene as a 3D point cloud.
Depth Camera View (RGB + Depth Overlay)
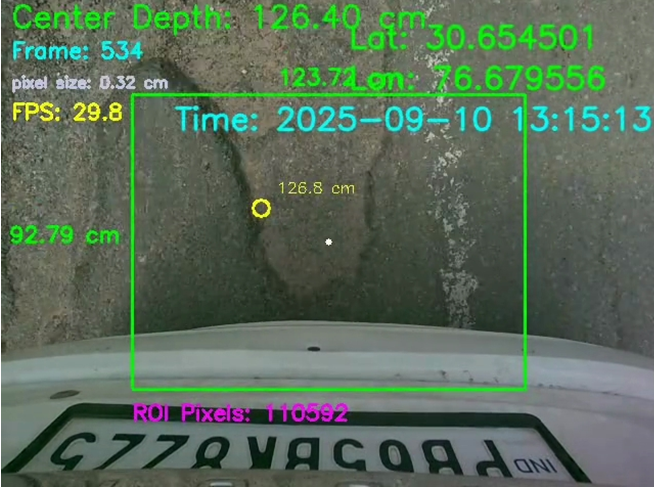
The image is a live RGB feed from a depth camera, enriched with overlaid information like distance, frame number, and GPS coordinates.
This data helps track and measure object distances in real time.
Key Annotations:
1. Center Depth: 125.40 cm
Indicates the distance between the camera and the central point in the Region of Interest (ROI).
2. ROI (Region of Interest):
The green box highlights the area being analyzed. This ensures the system focuses only on relevant sections, such as an obstacle or nearby surface.
3. Latitude & Longitude: 30.654502, 76.679555
GPS coordinates associated with the current frame — useful for geo-tagging and spatial mapping.
4. Frame ID: 001
Refers to the frame number from the continuous video sequence.
5. FPS: 30.0
Frame rate captured by the camera, essential for smooth real-time performance.
6. Timestamp: 2025-09-10 13:15:13
Synchronization time for accurate data tracking.
7. Measured Distance (Point Marker): 123.5 cm
The yellow circle marks a specific pixel on the surface, showing its real-time distance from the camera.
3D Point Cloud Visualization
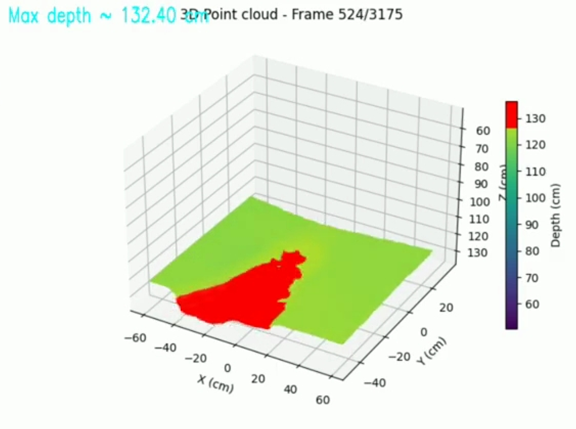
The right-side visualization transforms raw depth data into a 3D point cloud, where each pixel from the left image becomes a spatial data point (X, Y, Z).
This 3D model helps visualize how surfaces exist in depth — not just in 2D color space, but as actual 3D structures.
Key Observations:
1. Maximum Depth: ~132.40 cm
Indicates the farthest distance detected in this frame.
2. Color Map (Depth Scale): The right color bar translates depth values into colors for easier understanding:
3. Axes Representation:
I. X-axis: Horizontal position (left ↔ right)
II. Y-axis: Forward distance (camera ↔ scene)
III. Z-axis: Vertical height (depth from camera)
👋 Hi! I'm Hanu AI
Hanu AI Beta v2.0
Your AI assistant